What is q?
q is the ratio between the value of companies according to the stock market and their net worth measured at replacement cost.
It can be defined to include or exclude corporate debt. When debt is included, we refer to the ratio as Tobin’s q, as it was in this form that Nobel Laureate James Tobin introduced the concept. For stock market purposes, however, it is easier to exclude debt and we refer to it in this form as “equity q”.
The data from which q is calculated are published in the “Flow of Funds Accounts of the United States Z1”, which is published quarterly by the Federal Reserve. This data source is available from 1952 onwards. Earlier data are available from a variety of sources from 1900. (For an academic article on the data and sources see Stephen Wright’s “Measures of Stock Market Value and returns to the US Non-financial Corporate Sector 1900-2002.”)
Why is q Important?
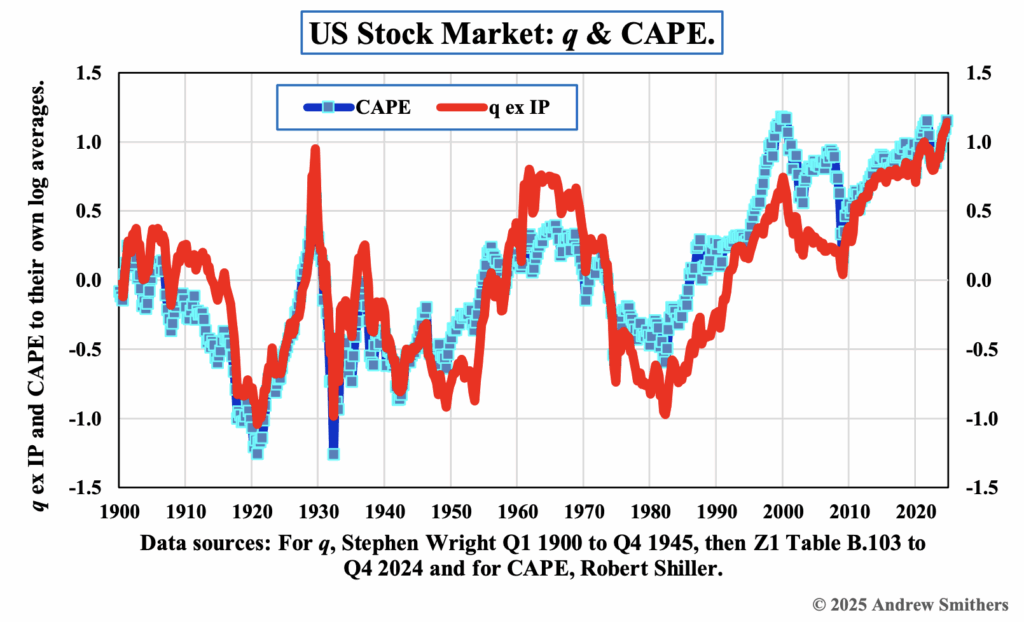
q is one of the two valid methods of measuring the value of the stock market. The other is the cyclically adjusted P/E. As they are both valid measures they both give the same answer, subject to small variations arising from the differences in data sources. (Investors who wish to learn more about this should read Chapter 26 of Valuing Wall Street and Chapter 8 of Wall Street Revalued.)
Why is q on Average Less than 1?
Over the long-term, the average value of q is around 0.63. To work out the current degree of over or under-valuation, it is necessary to compare the value derived from the data in the “Flow of Funds Accounts” with this average.
The long-term average value of q is below 1 because the replacement cost of company assets is overstated. This is because the long-term real return on corporate equity, according to the published data, is only 4.8%, while the long-term real return to investors is around 6.0%. Over the long-term and in equilibrium, the two must be the same.
The major cause of over-valuation of assets is almost certainly due to their economic rate of depreciation being underestimated. (See Appendix 1 Report 180 “A Monthly Proxy for q Using S&P 500 Data.”, Report No. 289 “Intangibles: Issues for Profits, Asset Values and Depreciation.” and Chapter 17 of Wall Street Revalued.)
How Does q Differ from Price to Book?
q is the ratio of price to net worth at replacement cost rather than the historic or book cost of companies. It therefore allows for the impact of inflation. In addition, balance sheet figures use reported earnings figures to derive book value, whereas the Fed’s net worth figures are consistent with the (more rigorous) national income measures of profits.
What Is q for Other Markets?
q data for countries other than the US is either non-existent, or too short-term, or of poor quality, to be used to value the markets. One problem is that public or quasi-public sector companies often get lumped into the data.
We have developed ways of circumventing the problem created by these data imperfections. See Report No. 328 “World Stock Market Value at End 2008.”
Can Other Markets Be Valued?
In the absence of direct information on q, inadequate data for earnings means that neither proxy q nor the cyclically adjusted PE (CAPE) can be used for valuing markets. The best approach that we have therefore been able to find is to use the evidence that prolonged periods of good returns are followed by poor ones and vice-versa (this is technically known as the negative serial correlation of real stock market returns). By comparing average returns over the medium-term, i.e. the past 10 to 30 years, with long-term, i.e. the past 100 years or more, we can show the likelihood of good or bad returns over the next 5 to 10 years. (Report No. 265 “Past Returns as a Guide to the Future for 15 Equity Markets.” 14th March, 2006 and No. 225 “G5 Stock Markets: Returns Are Not Random.” 30th September, 2004.)
Does the Existence of Intangible Assets Invalidate q?
No, the evidence is that the aggregate value of intangibles, if any, does not change over time relative to the replacement value of tangible assets. This is shown by the mean reversion of q relative to its average. For an academic analysis see “What Does q Predict?” by Donald Robertson and Stephen Wright, available on http://www.econ.bbk.ac.uk/faculty/wright.
N.B. Value is of little guide to short-term market performance. If markets habitually rose when they were cheap and fell when they were expensive, they would never become mis-evaluated.
If We Can’t Use Value to Judge the Short-term Outlook, What Can We Use?
Quite probably nothing: if any technique was shown to be a good short-term predictor of the stock market, then it would be rapidly exploited and cease to work.
It may, however, be that a number of indicators with weak predictive powers can be used in aggregate to provide some help to investors about probabilities. In this respect we have looked at volatility (Report No. 184 “Stock Market Volatility.” 11th November, 2002), profits (Report No. 238 “Do Profits Matter for Stock Markets?” 19th April, 2005) and cash distributions to shareholders (Report No. 268 “The Cash Yield: A Guide to Short-Term Market Returns?” 27th April, 2006).
What Then Is the Use of Value?
Understanding value is vital for investors.
(i) It provides a sound way of assessing the probable returns over the medium-term.
(ii) It provides information about the current risks of stock market investment.
(iii) It enables investors to avoid nonsense claims about value. (Report No. 249 “A Guide to Stockbroker Economics.” 15th August, 2005.)
Does q Work for Individual Companies?
q can be used for valuing individual markets, but not for individual shares. This is mainly because the impact of intangibles is very different. Whilst these don’t affect the aggregate value, as explained in the previous section, they can be very important for individual companies. (Report No. 167 “Value, Market Efficiency and Intangibles.”10th October, 2001.)
In addition, the adjustments for inflation to arrive at replacement cost estimates for asset values, which are necessary for estimating q, are available on a national basis, but not for individual companies.
Despite this, there is evidence to suggest that companies that have high book-to-price ratios outperform those that have high price-to-book ratios. Whether this is an example of market inefficiency, or an accidental and thus spurious result, is a hot debate within academic literature. Other examples of outperformance, such as the “small company effect”, appear to have been spurious in that they disappeared almost as soon as they were observed.
If the “Fed Model” Suggests that Stocks are Cheap, Shouldn’t I Back the Market?
The so-called “Fed Model” attempts to value shares relative to nominal bond yields. There is no justification for this either in theory or practice. (Report No. 133 “The Myth of Yield Ratios.” 10th May, 1999.)
Whatever your view about the abilities of the Federal Reserve, it would be slanderous to lay the blame for the “Fed Model” at their door.
In Report No. 133 we showed that the observed positive correlation between dividend and earnings yields on shares and the yield on bonds applied only in the US from 1977 to 1997. It has not applied since. Furthermore, there was a marginally stronger negative correlation from 1948 to 1968 and no long-term relationship whatever. The bond yield myth is thus an egregious example of data mining.
How do I view the Japanese Economy?
Up to September 2009 we had persistently warned that the economic and stock market outlook for Japan was worse than was generally recognised – see for example Reports No. 310 “Japan: Poor Market Outlook, Notably for Manufacturing” 10th June, 2008 and No. 318 “Japan: A Weak Economy, Falling Profits and a Strong Yen.” 16th September, 2008.
Subsequently we have, with equal persistence, warned that the general view had moved from over-optimism to excessive pessimism – see for example Reports No. 344 “A Better Profit Outlook for Japan than for the US” 17th September, 2009, No. 347 “Japan: A Brave New World?” 12th November, 2009 and No. 358 “Japan: The Dramatic Jump in Profits Should be Sustained.” 25th March 2010.
The Japanese stock market is probably the least expensive of all major markets and has relatively good profit prospects, partly because depreciation is large and falling. Due to its volatility and high correlation with the US, relatively good performance is more likely during market rallies than during falls.
Bonds, as everywhere, are very poor value but less vulnerable in the short-term than generally viewed. See Reports No. 359 “Japan & UK: Coping with the Government Debt Overhang.” 8th April, 2010 and No. 360 “Lessons from Post-Bubble Japan.” 29th April, 2010.
NB. As at 30th June, 2010 the Nikkei 225 index stood at 9382.64 and the TOPIX at 841.41.
N.B. As at 24th September, 2008 the Nikkei 225 index stood at 12115.03 and the TOPIX at 1167.97.