US CAPE and q chart
|
|
S&P 500 |
q Value |
q ex IP Value |
CAPE Value |
|
31st December 2024 |
6010.91 |
2.81 |
3.13 |
3.16 |
|
31st March 2025 |
5611.85 |
2.62 |
2.92 |
2.95 |
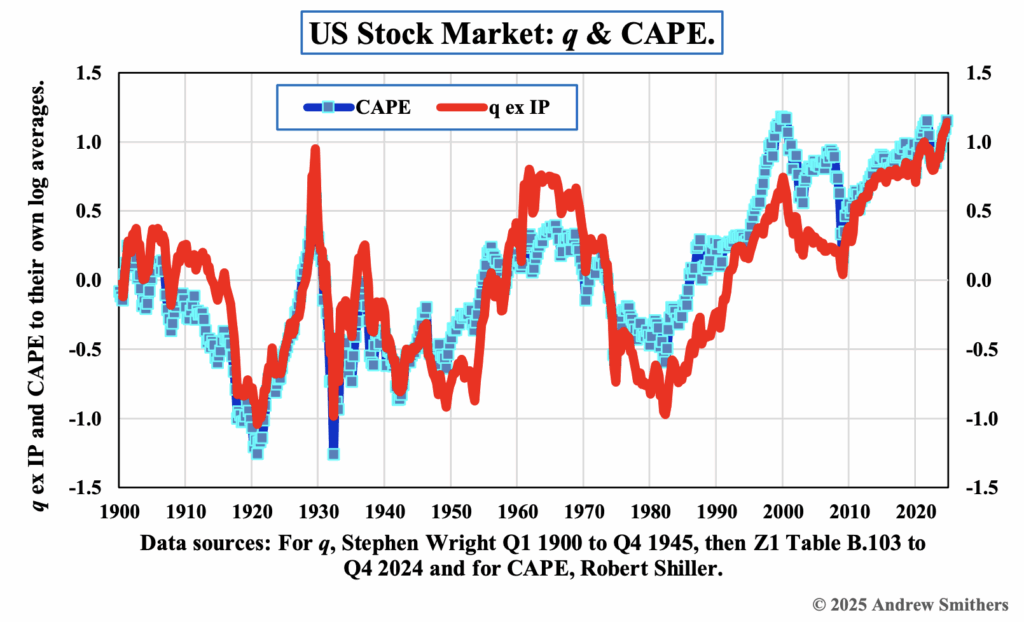
The data for q and CAPE are updated to 31st December 2024.
I have been updating the values for q and CAPE at least since 2000 when Stephen Wright and I published Valuing Wall Street (McGraw Hill 2020), and I have been publishing my calculations of their values every quarter for many years. Having reached 87 last year, I have decided to stop doing this with the publication of the year end data for q (Z1 Table B.103).
There are several ways in which small differences in the method used to calculate the two metrics give mildly different answers, and anyone who wishes to continue to make these calculations is welcome to ask for copies of my spread sheets and, as other people’s spread sheets are often difficult to understand, for the next few months I will try to respond to questions about them (info@smithers.co.uk).
I have only encountered three ways in which the value of the US stock market can be sensibly calculated. In addition to q and CAPE, Donald Robertson and Stephen Wright have published their “pseudo indicator” which is based solely on past returns. Testing for Redundant Predictor Variables (2009) (working paper downloadable from http://www.econ.bbk.ac.uk/faculty/wright). All three indicators give very similar results, and this is one way in which they provide an important test for their validity as reliable metrics. They also test well against ‘hindsight value’, as explained in Chapter 15 of The Economics of the Stock Market by Andrew Smithers (2022) Oxford University Press. Based on data from Q1 1900 to Q4 2019 I calculated the coefficients of determination (R squared) for CAPE as 0.52 and for q as 0.80.
In a series of small changes starting in 1999, followed by a large change in 2012 (The BEA’s 14th Amendment), the treatment of intangible investment (IP or IPP) in US, and most other countries’, national accounts was significantly changed. For a critical analysis of these changes see Labour Share Decline and Intellectual Property Products Capital (2020) by Dongya Koh, Raul Santaeulalis-Llopis & Yu Zheng, Econometrica Volume 88, Issue 6 November 2020. In the data currently published, US national accounts treat IP as final output, whereas it was formerly treated as intermediate output. World Economics in June will publish my new paper which shows that this decision was ill advised and should be rescinded, as the return on equity derived from US national data is only compatible with the return on equity derived from stock market returns when IP is treated as intermediate output. One result of this analysis is that the value of IP should be excluded from net worth calculations for q. When this is done, the current measure by which the US stock market is overvalued becomes even more similar than before, whether measured by q or CAPE.
I am therefore signing off my quarterly analyses of the US stock market value at a time when it is overvalued by around 3 times according to both q and CAPE, which matches or surpasses the previous great overvaluation of 1929.
Data for my calculations of q are taken for 1900 to 1945 from Measures of Stock Market Value and Returns for the Non-financial Corporate Sector 1900-2002 by Stephen Wright, published in the Review of Income and Wealth (2004) and for 1945 to 2024 from the Financial Accounts of the United States (“Z1”) published by the Federal Reserve. Data for our calculations of CAPE are taken from the data published on Robert Shiller’s website. B.103 data for net worth are only available annually before 1952 and I have calculated the quarterly data by interpolation, assuming that changes are evenly spread over each year. I link the q values by using those from B. 103 from Q4 1945 to those calculated by Stephen Wright. I have calculated CAPE using geometric means for the 10 year averages on the grounds that this is mathematically more appropriate.
Andrew Smithers
London
1st April 2025.